Energy Cluster Findings – The Future of Asia: Implications for Canada

PDF: Energy Cluster Findings – The Future of Asia: Implications for Canada
On this page
Introduction
Summary of Key Energy Changes in Asia and Policy Challenges & Opportunities for Canada
Key Changes in Asia (Insights)
- Asia’s shifting energy mix
- Asia is building a low-carbon energy infrastructure
- Asia leads on climate change and the low-carbon economy
- Electricity distribution business models are evolving
Policy Challenges and Opportunities for Canada
- Mitigating public sector risk from lower oil demand
- Emerging green protectionism in Asia pushing for carbon transparency
- Meeting Asia’s increasingly diverse energy demand
- Asia exports cheap renewables to the world
Note to the reader
This Energy Cluster Foresight Study explores key changes in Asia and related policy challenges and opportunities for Canada. The key changes are in the form of “insights”, which identify existing and emerging developments that may significantly alter the system under study. Insights help build our understanding of how an issue or system may evolve and what the consequences might be. A policy challenge or opportunity is an issue that current policies or institutions may not be ready or able to address. Identifying, analyzing, debating and clarifying challenges or opportunities help policy makers develop more robust strategies.
Part of the Horizons Foresight Method also involves the exploration of plausible scenarios and the identification of robust assumptions. These are included in the MetaScan on “The Future of Asia” which integrates the high level insights and policy challenges and opportunities from all four cluster studies (economic, energy, geostrategic, social).
The key changes and potential policy challenges and opportunities explored in this study are intended to be provocative in order to stimulate thinking among public servants about the future. They do not reflect a view of the most likely shape of change in Asia or consequences for Canada, but rather plausible developments that merit consideration. While this study’s development involved participation and contributions from officials across multiple departments within the federal public service of Canada, the contents of the study do not necessarily reflect the individual views of participants or of their respective organizations.
Introduction
Asia is a continent in rapid transition creating an energy landscape that is a study in contrasts. Many of its countries are at the cutting edge of energy technology yet hundreds of millions of Asians still lack access to reliable electricity. A heavy reliance on fossil fuel powered electricity plants and transportation has created the world’s most severely air polluted cities, yet Asia is also home to among the world’s largest clean energy investments.1
China solidified its leadership position in the global clean energy race by attracting $54.2 billion of investment in 2013. – Pew Charitable Trusts, 2014
Across a range of plausible scenarios over the next 10-15 years, Asian governments will face strong demand for energy from a growing middle class and the expanding digital economy while simultaneously facing strong pressures from their populations and businesses to shift to less polluting and lower carbon energy sources. Although a transition in Asia’s energy mix will still be underway in 2030, fossil fuels will be increasingly displaced as the primary energy source (electricity that is generated predominantly from renewable sources). A number of structural, technological and behavioural changes have been identified that could lead to an earlier than expected peak in Asian oil demand followed by a steeper than anticipated decline.
Asia is expected to continue to develop and deploy new technologies for renewable energy production, distribution and storage. As Asian countries shift to a low-carbon energy footing, they may become more assertive in calling for and meeting greenhouse gas emissions targets. They may also consider carbon-based trade or economic measures to leverage competitive advantages in a global market with explicit or implicit carbon pricing.
Asia’s cost of renewable energy is expected to fall due to economies of scale in its internal market, its formidable manufacturing capacity and strong political support. Low costs of production combined with accelerating experience in the deployment and management of renewable energy could make Asia the global market leader and world’s largest exporter for clean, low-carbon energy technology. Asian countries could apply pressure to deregulate mature Western electricity markets to permit entry of Asia companies and products. This could challenge central utility based business models.
Summary of Key Energy Changes in Asia and Policy Challenges & Opportunities for Canada
The following section summarizes the key energy changes (insights) that are shaping Asia and the potential policy challenges and opportunities for Canada addressed in this study.
Key Energy Changes in Asia (Insights)
1. Asia is shifting to an electricity-driven digital economy
Structural economic changes accompanying this shift may combine with technological advances and behavioural changes to cause Asian demand for oil to peak earlier and then decline more steeply than expected.
2. Asia is building a low-carbon energy infrastructure
Asia will increasingly be able to meet its electrical energy requirements with renewable sources. As Asia scales up adoption of renewables, it could lock-in a long-term economic advantage for the region based on low-carbon, low-cost electricity production.
3. Asia could become the leader on climate change and the low-carbon economy
As Asia decouples economic growth from carbon emissions and air pollution it is no longer forced to make trade-offs between development and environmental degradation. Asian countries could emerge as leaders in the climate change debate, increasingly setting the international agenda and potentially pushing for ambitious emissions reduction targets, trade measures, carbon pricing mechanisms or carbon content disclosure requirements.
4. Asia will develop new business models for energy production and distribution
Asia will be an incubator and early adopter of new business models for electricity based on the low-cost, scalability and decentralization of renewable energy and on the increasing use of smart and interconnected distribution grids at all scales. Asia may pressure Western countries to open their government-controlled electricity markets to competition.
Policy Challenges & Opportunities for Canada
1. Mitigating public sector risk from lower oil demand
Lower than expected demand for petroleum products in Asia could contribute to weak crude oil markets. Canada may find it difficult to compete with low-cost producers leading to a loss of tax and royalty revenues (impacting fiscal budgets) and decreased investment in the petroleum sector (impacting employment and increasing the risk of public investment in petroleum related assets). Governments may also need to ensure adequate safeguards are in place to address decommissioning and remediation of extraction sites and infrastructure if companies exit the sector.
2. Meeting Asia’s increasingly diverse energy demand
Opportunities to compete in the emerging Asian energy market do not need to be based on being the most cost competitive supplier of fossil fuels, but rather on supplying new materials, technology and expertise. Canada has experience in a number of potential areas including supplying the resources upon which renewables and the digital economy are built, as well as in energy efficiency and management. Canada could leverage its cool climate and renewable electricity to host data centres.
3. Preparing for Asian carbon content requirements
Canadian goods including primary energy and natural resources as well as services may face trade restrictions or challenges from Asia based on their carbon content. Canadian exporters may be required to disclose carbon emissions/footprint information to maintain access to Asian markets. Canada and the U.S. could shift to a low-carbon, low pollution regional energy infrastructure by optimizing the deployment of renewable energy to areas of comparative advantage.
4. Low-cost renewables and pressure to open markets could challenge power utility business models
Renewables reaching grid parity in Canada without subsidies may challenge Canadian utilities to provide cost-competitive electricity under the existing central utility model. Prices for electricity from central utilities may increase as renewables offset power from central plats optimized for continuous operation. The uncertainty about the time frame in which renewable energy devices may become cost-competitive with central utilities’ prices increases the risk of public investment in large, capital intensive new power generation sources as return on investment is more uncertain.
Key Changes in Asia (Insights)
Asia’s shifting energy mix
Asia is shifting from an oil-driven manufacturing economy to an electricity-driven digital economy. It is plausible that a number of emerging trends accompanying this shift will combine to cause Asian demand for oil to peak earlier and then decline more steeply than expected by many forecasters. First, demand for oil could soften due to structural shifts in the Asian economy and technological and behavioural changes that reduce the requirement for physical transportation of goods or people. In addition, oil demand for transportation could be affected by efficiency gains from better logistics as well as fuel switching and modal shifts. Finally, energy security and air pollution concerns may also impact oil demand by driving policies to reduce imports and use of petroleum-based fuels. Combined, these changes in Asia could lead to lower than expected global demand for oil. In turn, this could result in lower global oil prices if low-cost oil producers do not curtail supply as they compete to maintain their respective shares of a rapidly diminishing market, seeking to maximize the extraction of their reserves before oil is replaced as a predominant energy source.
Additive manufacturing
Advances in additive manufacturing (3D printing) are not only expected to influence the production of solar panels but also to result in more goods being produced locally on demand reducing the requirement for physical transport of manufactured goods over distance. International supply chains will be increasingly based on the movement of data, with finished goods only requiring local transportation. Additive manufacturing is poised to have significant structural impacts on energy demand for manufacturing broadly, from resource extraction, to production, distribution, transportation and even consumer behaviour and shopping habits. By 2030, the 3D printing of a broad range of industrial and consumer goods, including solar panels, will likely have grown from today’s small scale, contributing to a profoundly different energy consumption and production model.2 Depending on the rate of penetration in consumer goods markets for 3D printing, economies of scale typical of the manufacture of most consumer goods may become a model of the past, as may long-distance shipping of finished products.3
Asia is embracing this technology both in producing it for export and in using it for domestic manufacturing.4 3D printing of buildings as well as for industrial prototyping in the health and automotive sectors is growing in Asia. Sinopec, Asia’s largest oil refiner, has recently decided to enter the 3D printing materials and renewable energy markets.5 Open source technologies are also being developed to enable small scale users to transform waste plastic into 3D printing feedstocks, further reducing the need for primary petro-chemical inputs and altering the structure of energy demand.6
Telepresence, virtual work and online living
Technological improvements in telepresence and increased acceptance of telework are expected to reduce the requirement for physical movement of people to their place of work or for leisure. Telecommuting is increasing around the world, especially in emerging markets and in Asia. India was the world’s leader in 2013 with 82% of workers telecommuting at least once a week, and 57% working remotely on a routine basis in 2013.7 Telework is also prevalent in China with 41% of workers teleworking at least once a week.8 Advances in remote robotics and collaboration with others using augmented reality such as holographic projection could expand telework beyond knowledge-based or data-oriented work into areas that previously required a physical presence.9 Cultural and behavioural shifts towards greater online entertainment, socialization and shopping are expected to reduce the requirement for physical travel.10 Online recreation in the form of games and socializing is also an interesting phenomenon: 45.7% of the world’s Internet users reside in Asia as of 2014, and China, Japan and South Korea dominate the global video game market.11
Urban automobile use
Travel distances for work, shopping and recreation could be significantly reduced by incorporating “compact and connected” urban design principles.12 Asian cities are undergoing rapid growth and renewal. Urban governments are investing heavily to expand and improve public transit to offset increases in personal vehicle use. Governments are also attempting to reduce congestion and improve air quality by restricting the number of vehicle registrations permitted in urban centres or limiting the use of personal vehicles. The Chinese government recently announced that the number of cars allowed to be registered in Beijing will be reduced by 60,000.13 Restrictions on vehicle registrations are currently in place in 8 of China’s largest cities.14
Electric vehicles
Asian governments support increasing the number of electric vehicles on their roads to meet air quality objectives and advance industrial policy aimed at capturing global Electric Vehicle (EV) markets.15 A number of governments (e.g. India16 China17 and South Korea18) have implemented measures to support new additions to urban vehicle car fleets being predominantly comprised of EV or hybrids. Government support, coupled with Asia’s formidable manufacturing capacity19 and large vehicle market could combine to lower EV costs significantly. Battery prices are expected to fall due to improvements in battery design and manufacturing technology.20 Economies of scale could increase rapidly as similar batteries also become widely used for renewable energy storage.21
Sales of EVs may grow faster than predicted as range limitation concerns are addressed through improvements in battery and charging technology and shifts in consumer expectations/driving behaviour as experience with electric vehicle grows.22 Government support for EV based car sharing programs could increase the EV share of vehicle use in urban centres by eliminating the high capital cost of individual ownership.23 China’s Kandi EV Car-Share makes electric cars in automated garages available to customers at a rental price of $3.25 USD per hour. The program had deployed a total of 14,398 vehicles throughout the country as of the end of 2014.24 Scooter and three-wheeled vehicle electrification in Asia could also increase rapidly with predictions of a nearly tenfold increase in electric scooters – from 12 million to 103 million on Asian roads by between 2012 and 2018.25
Modal shifts and improved logistics
Asian governments may support modal shifts and improved logistics for the movement of goods and people. Many Asian countries have poorly developed highway infrastructure and therefore are not heavily invested in a highway-based transportation system.26 Rather than follow the pattern of moving freight and people by road, they may invest in electrified rail infrastructure for intercity movement of goods and people. China already has the largest high-speed rail network in the world and is planning to invest $300 billion to construct 30,000 km of high speed rail lines by 2020.27 These will use among the world’s most technologically advanced trains.28 Advances in logistics for existing truck and taxi fleets and improved traffic management systems could reduce fuel use by increasing transportation efficiency and reducing the need for additional vehicles to meet increases in demand.
Wildcard– Asia’s Trucking Sector
Representing 9% of Asia’s vehicles but 54% of road transport CO2 emissions (Smart Freight Centre, 2014, pg.2), Asia’s trucking sector holds considerable promise to dramatically change climate pathways and oil demand should it transform. Unlike India, South Korea and Japan where passenger cars predominate, the reverse is the case in China where small delivery trucks are reportedly less expensive than televisions (UMTRI, 2010. Pg.7). Fleet ownership is also highly fragmented with few large companies and many single owners (Clay Stranger, interview, August 22, 2014). China is now supporting the shift to natural gas for trucks and buses, and should subsidies for inner-city electric trucks be introduced, demand for petroleum based fuels for freight in China could decline rapidly (Rakim, S. 2014).Fleet consolidation and artificial intelligence (AI) supported advanced logistics could also introduce rapid efficiency improvements.
Fuel switching
Natural gas or biodiesel may be increasingly used for land-based heavy vehicles. Over the last decade, Asia has become the largest market for natural gas internal combustion engine powered vehicles. Approximately 7 million vehicles were on the road in 2014 and continued strong growth for fleet conversion is projected.29 Advances in synthetic biology may lead to the development of cost-competitive “drop-in” biofuel alternatives for transportation modes that are more difficult to electrify such as long-haul heavy trucks, construction and mining equipment, ships and aircraft.30
Carbon pricing measures
Governments in Asia are adopting measures that price carbon. Emissions trading systems, carbon taxes and carbon footprinting metrics are being implemented to meet air quality and greenhouse gas emissions reduction targets. These are expected to shift energy away from petroleum-based fuels by directly or indirectly increasing their cost. This trend is discussed further in a following section.
Energy security
Major Asian importers may work to reduce their dependence on foreign oil. Governments may work to shield their economies from the potential for increasing supply and price volatility if an extended period of low prices reduces production by high cost producers while political instability increases in low-cost producers that rely on high oil prices for domestic program spending.31
Asia is building a low-carbon energy infrastructure
Asia will be increasingly able to meet its electrical energy requirements using low-pollution, low-carbon, renewable sources.32 Advances in technology and rapid decreases in cost are allowing renewables to be widely deployed across Asia in applications that range from highly decentralized individual energy production through to grid-connected mega-projects. International connections of national-level grids and related energy-sharing agreements are increasing renewable energy production on a regional basis by permitting countries connected to “super-grids” to deploy the technology best matched to their comparative advantages in electricity production from wind, solar, hydro or geothermal energy. As Asia scales up its adoption of renewable electricity, it could lock-in a long-term economic advantage for the region based on low-carbon, low-cost electricity production.
Video: “Asia’s renewable energy future” Thomas Lloyd (global investment bank)
Unprecedented growth in renewable energy across Asia
Renewable energy installations in Asia are often surpassing official projections made only a few years ago.33 In 2013, China added more generating capacity from renewables than from fossil fuels and nuclear combined and invested more in renewable energy than all of Europe. 34 Japan increased investment in renewable energy by 80% in 2014.35 Even emerging economies with significant conventional and unconventional fossil fuel reserves are choosing to invest in renewable electricity developments.36
Video: Energie solaire : le Pakistan va exploiter le désert du Cholistan (available in French only)
Renewables are cost competitive with fossil fuel electricity generation
Electricity prices from hydro, biomass, geothermal and on-shore wind are already cost comparable or cheaper than electricity from fossil fuel fired thermal generation plants.37 Asia has among the world’s cheapest cost of electricity from these renewables, largely due to lower financing costs.38 The cost of utility scale solar photovoltaic (PV) electricity declined by up to 65% between 2010 and 2014 (see Figure 1) bringing it into direct competition with fossil fuel generation in some areas.39 Further cost reductions of 40% predicted over the next two years are expected to accelerate Asia’s deployment of this technology at all scales.40 Renewable energy’s cost competitiveness is amplified if health and carbon external costs of fossil fuels are included.41
Figure 1 – Cost of renewables compared to fossil fuel power generation
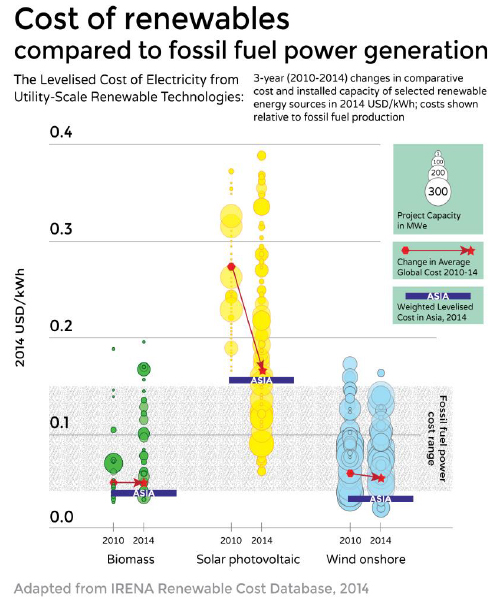
This graph is entitled “Cost of renewables compared to fossil fuel power generation”. The graph shows the levelised cost of electricity from utility-scale renewable technologies (biomass, solar photovoltaic and wind onshore: 3-year (2010-2014) changes in comparative cost and installed capacity of selected renewable energy sources in 2014 USD/kWh; costs shown relative to fossil fuel production. The cost of biomass stays relatively the same from 2010 to 2014, while the cost of solar photovoltaic decreases significantly and the cost of wind onshore has only slightly declined. Biomass and wind onshore shows up at the bottom of the fossil fuel power cost range, while solar photovoltaic is reaching the upper boundary. Also, there is a significant increase in larger scale solar photovoltaic projects in 2014 than in 2010. Adapted from IRENA Renewable Cost Database, 2014.
Renewables like wind and solar also have advantages in being faster to install than thermal or nuclear power plants, having lower capital cost and in not requiring water for cooling or for the extraction of fuel, mitigating the pressure on this increasingly scarce water resource for many parts of Asia.42
Electricity storage and transmission is advancing rapidly
Renewables will be able to contribute significantly to meeting around-the-clock energy demand. Advances in energy storage and wide-scale electricity grid integration are expected to address issues of variable output from wind turbines and solar panels. Large capacity, utility-scale storage using batteries, compressed air, molten salt, pumped hydraulic storage and flywheels are being developed and implemented around the globe potentially displacing natural gas and diesel for back-up or peak demand in larger integrated grids.43 Asia is leading the world in the number of patents related to energy storage.44 Asian EV manufacturers are exploring the use of smart grid connected EVs as storage options for individual and commercial electricity storage as well as repurposing end-of-useful-life EV batteries for stationary storage. By bundling large numbers of physically discrete smaller EV batteries into one massive “virtual” battery, EVs could potentially add millions of KW of storage to grids.45
Experience from European countries with high percentages of electricity supply from solar and wind power suggests that interconnected grids at national and regional scale enable the distribution of wind and PV based power from areas of surplus to areas of demand reducing the need for massive amounts of storage.46 Storage does not appear to become a limiting factor in adding these technologies until they reach significant percentages in the power generation mix (over 60%) suggesting that wind and PV energy still have significant growth potential in Asia even in the absence of low-cost storage solutions.47
Asia leads on climate change and the low-carbon economy
Asia is expected to increasingly decouple its economic growth from carbon emissions and air pollution as it continues to electrify with renewable energy and shifts to a more digital and service-based economy. In addressing air pollution and carbon emissions from electricity generation and transportation, Asia is expected to solidify its position as a world leader in the production and integration of low-carbon and energy-efficient technologies.48 No longer forced to make trade-offs between development and environmental degradation, Asian countries could emerge as leaders in the climate change debate, increasingly setting the international agenda and potentially pushing for ambitious emissions reduction targets. Asia could adopt trade measures, carbon pricing mechanisms or carbon content disclosure requirements to drive global action, in part to hedge against the disproportional impact climate change is expected to have on the region, but also to increase exports and gain market share by leveraging its leadership in technologies that reduce or avoid greenhouse gas emissions.
Asian industrial policies support a shift to a low-carbon future
A number of Asian countries have articulated industrial development strategies for renewables, energy efficiency and electric vehicles. These were three of the seven industries identified in China’s 12th Five-Year Plan on National Emerging Industries of Strategic Importance.49 India is also setting out policies to position itself as a global player in PV.50 In contrast to gasoline-powered cars, where entrenched foreign competitors would be hard to challenge, battery-based technologies offer an opportunity to leapfrog foreign competitors.51 Both China and India have ambitions to claim a significant share of the global electric vehicle market.52 Japan is a world leader in hybrid gasoline-electric vehicles. Massive manufacturing capacities and state support can place Asia in a good position to direct its industrial policies towards low-carbon technologies for energy production and transportation.53
Asia will become the low-cost producer of renewable energy
Large internal demand by Asia will increase economies of scale and accelerate learning curves in the production of renewable electricity technologies, driving down costs on the global market. 54 Asia will also be an innovation test bed for technologies and best practices for integrating renewable energy into the energy mix as well as for demand and supply management for intermittent generation from wind and solar.
Air pollution kills millions of Asians
Increasingly vocal and mobilized Asian populations are forcing governments to take action on air pollution.55 The air quality in many Asian cities is ranked among the worst in the world especially for the particulates generated from coal and diesel combustion that are the most harmful. Two thirds of Asian cities fail to meet the European Union’s air quality standard for particulate matter with diameter of 10 micrometers or less.56 According to the World Health Organization, air pollution kills approximately 7 million people globally with the situation being especially dire in the Asia-Pacific region.57 China accounted for 40% of the world’s premature deaths from air pollution in 2010 and was also cited as the fifth leading cause of death in India in 2014.
Video : Chine : comprendre l’ampleur de la pollution en trois minutes (available in French only)
Climate change impacts are higher in Asia
Asia will be disproportionately affected by climate change. Asia is home to nine out of ten cities in the world ranked most vulnerable to natural disaster. Most of the disasters cited – flooding, storm surges and high winds – can be expected to become more severe and frequent due to climate change.58 Flooding rivers alone are expected to affect 380 million people globally, most of them in Asia. Asian populations living below the poverty line are expected to be hit hardest as they have the fewest resources to move or adapt to mitigate their risks or to recover from losses. While Asia cannot escape from climate change related impacts in the near term, it is in the long-term interests of the region to mitigate risks through global reductions in greenhouse gas emissions.
Highly polluting activities and energy sources will be curtailed
Asian countries are imposing direct bans and restrictions on highly polluting activities. China and other Asian countries such as Indonesia are actively intervening to limit coal use. Key Chinese interventions include the prohibition of all coal with high sulfur and ash content as of January 2015, the closure of 50,000 small coal fired furnaces also by January 2015, the capping of coal use to below 65% by 2017 across China, and a complete ban on coal use in the city of Beijing by 2020.59
Emissions trading systems & carbon taxes grow in Asia
Asia will become the world’s largest carbon pricing regime. The first nationwide cap-and-trade system in Asia was created in December 2012 by Kazakhstan.60 In January 2015, South Korea launched an emissions trading scheme that is currently the world’s second biggest carbon market.61 While still the largest emitter of greenhouse gases in the G-20, China committed to seeing its carbon emissions peak by 2030, and launched seven sub-national emissions trading schemes in 2013.62 China also has committed to establishing a national regime in 2016 that will become the largest carbon market in the world.63 Emissions trading schemes are also now under consideration in Japan and Thailand64(see Figure 2).
Figure 2 – Emissions trading schemes (ETS) in Asia
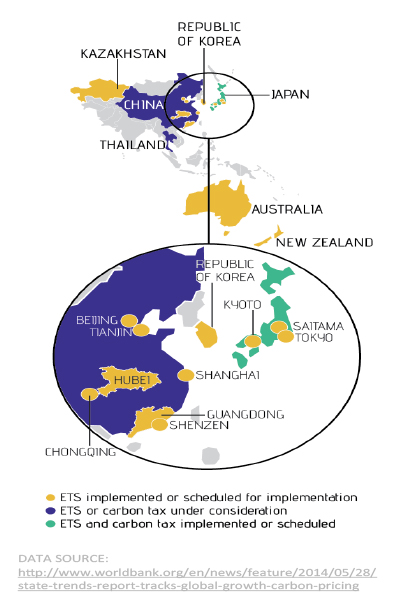
This image is a heatmap that depicts emissions trading schemes (ETS) in Asia. According to the legend at the bottom, countries fall into one of the following categories: 1) ETS implemented or scheduled for implementation; 2) ETS or carbon tax under consideration or 3) ETS and carbon tax implemented or scheduled. The following countries have been identified as having emissions trading schemas implemented or scheduled for implementation: Beijing, Tianiin, Hubei, Chongqing, Shenzen, Guangdong, Republic of Korea, Shanghai, Kyoto, Saitama, Tokyo. Data was taken from: http://www.worldbank.org/en/news/feature/2014/05/28/state-trends-report-…
India introduced a nationwide carbon tax of 50 Rupees per tonne on coal in July 2010 that it doubled in 2014.65 Japan’s Tax for Climate Change Mitigation was adopted in 2012 and covers the use of all fossil fuels such as oil, natural gas, and coal depending on their CO2 emissions.66
Carbon footprints in procurement decisions
Decision makers throughout the value chain may require carbon footprint information. The Chinese government issued its first low-carbon product certification in June 2014 noting that the introduction of the low-carbon production certification program will help people identify climate-friendly products when choosing what to buy. It also expects the certification will help mitigate climate change through market forces and motivate carbon intensive industries to take a low-carbon development path.67 In 2012, Wal-Mart – the world’s largest retailer – announced in China that by 2017 it will buy 70 percent of the goods it sells in the U.S. only from suppliers that use a Sustainability Index68 that includes metrics on energy use and greenhouse gas emissions.69 As sensors, machine to machine communication and big data analytics proliferate, the calculation and uptake of carbon footprints could grow rapidly for physical as well as virtual goods and services.70 Asian markets may attempt to further leverage emerging comparative economic advantage as well as meet emissions targets by requiring disclosure of carbon footprints for imported goods and services.
Electricity distribution business models are evolving
Asia will be an incubator and early adopter of new business models for electricity production and distribution based on the low-cost, scalability and decentralization of renewable energy and on the increasing use of smart and interconnected distribution grids at all scales. Many parts of Asia have a gap between energy supply and demand that will be expensive to close using the traditional model of centralized, state-owned large generating plants and extended distribution grids. In an Asian context, new business models complement existing centralized, state-run power plants and address supply gaps by accelerating large additions of renewable-based electricity to national grids and underserviced areas or markets. As new Asian-based business models proliferate and mature, Asia may pressure western countries to open their electricity markets to competition to allow Asia’s renewables-based energy companies to enter these markets as well as to increase market penetration and sales of its renewable energy technologies.
Multi-level grids
The scalability of renewables is affecting how electricity is distributed in Asia. Using the example of solar power, it is possible to see how many levels of “grids” or electricity transmission systems are now possible: at the device level (e.g. a solar panel on a smart phone), at the building level (e.g. solar panels on roofs or windows), at the city level (the aggregation of solar panels on roofs or windows), at the regional level (large-scale concentrated solar arrays feeding a central electricity grid)71 (see Figure 3).
Figure 3 – Levels of “grids” or electricity transmission systems

This figure illustrates the many levels of “grids” or electricity transmission systems are now possible. There are three groups down the right side of the graphic – macrogrids; microgrids and nanogrids. Associated with the macrogrids is the supranational grid and national grid. Under mircogrids we have neighbourhoods, which point to both macrogrids and nanogrids. Under nanogrids there is the building layer and electrical devices.
Renewable energy powered micro-grids are expected to flourish in Asia as they will help governments meet development goals. 72 Remote and rural populations with little hope of connection to a national electrical grid a decade ago could be provided with enough affordable electricity to power cheap Internet-connected devices that would allow them to become fully integrated into digitally-enabled work, education, healthcare and political discourse with socio-economic implications that expand well beyond Asia.73
Video: Japon : l’électricité, élément de survie après une catastrophe (available in French only)
At the community level, goals of energy self-sufficiency and reducing ecological impact are motivating investment in off-grid communities.74 The ability for buildings to generate their own electricity for their own consumption and/or to be fed into the grid is precipitating large investments by private landowners in building-level generation. Regional electricity grids are increasingly inter-connecting with one another to form larger geographic networks, better able to balance load, avoid energy loss and onboard renewables.
Nation-states in Asia and surrounding regions such are creating “super-grids” connecting power transmission lines between countries.75 These inter-connections of national electricity grids optimize the use of regional renewable energy resources by allowing excess power in one area to be utilized elsewhere providing Asia with a resilient and cost competitive low-carbon electricity system supporting broader regional standardization and economic integration.76 They also allow smaller economies to develop their competitive advantage in renewable energy projects at scales that they would not do for a purely domestic market.77
Smarter grids
Smart grids can create new business models and opportunities by directly connecting energy producers with energy consumers.
In 2014, China outspent the U.S. in investment in smart grids.78 China is leading in machine-to-machine communication (the Internet of Things) which, while still in its infancy, can foreseeably enable real-time demand side management of millions of energy consuming devices used for economic or personal activities.79 At the municipal (or local) level, entrepreneurial innovations by private producers in how and when energy is sold to end users or stored for later sale at more favourable rates could emerge as smart grids become more mainstream and electricity producers and consumers are able to establish direct purchase and sale contracts, potentially in real time, using state grids as the medium for exchange.
Power saved through conservation or efficiency measures has become a lucrative market in Asia in recent years.80
Many parts of Asia have embraced a range of energy efficiency technologies and programs.81 Governments like Japan are now considering creating a “Negawatt market” that would trade the electricity saved by cooperative business and households during peak demand periods. By turning the power off, customers would be considered to have sold electricity to the grid and would be rewarded with rebates. The combination of digital communication tools and the advances in the Internet of Things will greatly contribute to this exchange system by allowing customers to easily and remotely switch off their thermostat in real time.82 This energy efficiency measure will contribute to reduce overall energy demand, change energy consumption patterns, diminish peak energy demand and ease the transition from central energy sources to decentralized technologies.83
Policy Challenges and Opportunities for Canada
The rapid changes that may occur in Asia over the next 10-15 years will present Canada with a range of challenges and opportunities. This section highlights those that may be particularly surprising and unexpected.
Mitigating public sector risk from lower oil demand
Lower than expected demand for petroleum products in Asia could contribute to weak crude oil markets. Asian economic growth is considered a strong source of ongoing demand for fossil fuel energy in many forecasts.84 Signals from Asia suggest that its demand for fossil fuels could peak faster than expected (see Figure 4) in the next 10-15 years and remain soft as Asia transitions to a digital economy, builds-out energy infrastructure that is less dependent on hydrocarbons and shifts to an economy that could see per capita or even aggregate reductions in the demand for petroleum-based transportation fuels. Lower than expected demand could lead to long-term lower crude oil prices. Canada is a high cost85 oil producer and may find it difficult to compete with low-cost producers if global supply and demand equilibrium is maintained – leading to a loss of tax and royalty revenues (impacting fiscal budgets) and decreased investment in the petroleum sector (impacting employment and increasing the risk of public investment in petroleum related assets). Governments may also need to ensure adequate safeguards are in place to address decommissioning and remediation of extraction sites and infrastructure as companies exit the sector.
Figure 4 – Future of Asian Oil Demand
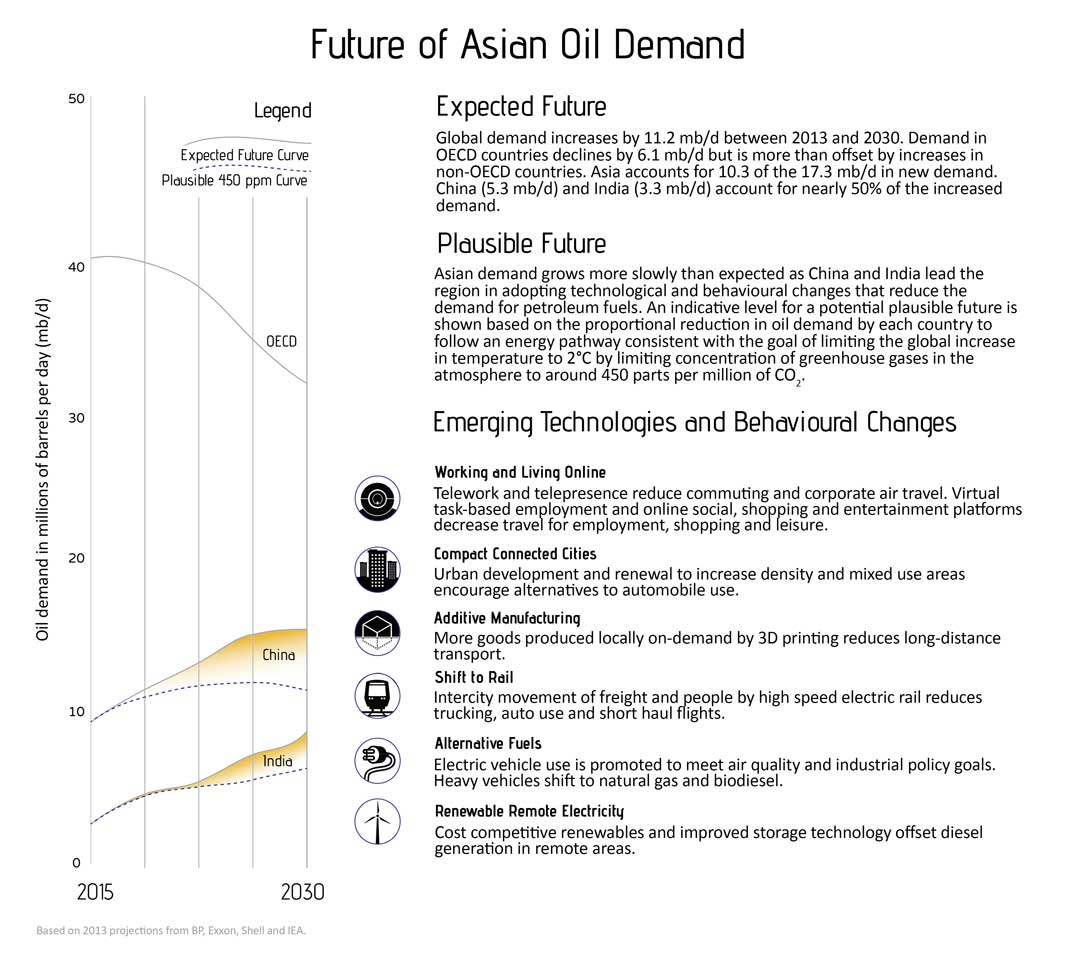
This graph is entitled “Future of Asian Oil Demand” and it suggests that Asia’s demands for fossil fuels could peak faster than expected in the next 10-15 years. The left side of the image is line chart with the x-axis representing the year 2015 and 2030 and the y-axis representing oil demand in millions of barrels per day. The descriptive text running along the right side of the image is positioned under the following three headings: Expected Future; Plausible Future and Emerging Technologies and Behavioural Change. Expected Future Global demand increases by 11.2 mb/d between 2013 and 2030. Demand in OECD countries declines by 6.1 mb/d but is more than offset by increases in non-OECD countries. Asia accounts for 10.3 of the 17.3 mb/d in new demand. China (5.3 mb/d) and India (3.3 mb/d) account for nearly 50% of the increased demand. Plausible Future Asian demand grows more slowly than expected as China and India lead the region in adopting technological and behavioural changes that reduce the demand for petroleum fuels. An indicative level for a potential plausible future is shown based on the proportional reduction in oil demand by each country to follow an energy pathway consistent with the goal of limiting the global increase in temperature to 2°C by limiting concentration of greenhouse gases in the atmosphere to around 450 parts per million of CO2. Emerging Technologies and Behavioural Changes Working and Living Online Telework and telepresence reduce commuting and corporate air travel. Virtual task-based employment and online social, shopping and entertainment platforms decrease travel for employment, shopping and leisure. Compact Connected Cities Urban development and renewal to increase density and mixed use areas encourage alternatives to automobile use. Additive Manufacturing More goods produced locally on-demand by 3D printing reduces long-distance transport. Shift to Rail Intercity movement of freight and people by high speed electric rail reduces trucking, auto use and short haul flights. Alternative Fuels Electric vehicle use is promoted to meet air quality and industrial policy goals. Heavy vehicles shift to natural gas and biodiesel. Renewable Remote Electricity Cost competitive renewables and improved storage technology offset diesel generation in remote areas.
Emerging green protectionism in Asia pushing for carbon transparency
Canadian goods including primary energy and natural resources as well as services may face trade restrictions or challenges based on their carbon content.
If the Asian and European energy mix shifts towards low-carbon, governments may seek to erect barriers to protect their markets from higher carbon content imports or conversely, to challenge trade measures that are seen as discriminating against Asia’s and Europe’s lower carbon exports by protecting high carbon sectors in developed world economies.
Canadian exporters may be required to disclose carbon emissions/footprint information to maintain access to Asian markets.
Capital markets, global retailers, and a number of governments are actively pushing for disclosure of carbon footprint data. With renewable low-carbon energy growing in the share of Asia’s energy mix, Asian countries or trade blocks may plausibly see an economic or competitive advantage in promoting carbon footprinting as a means of positive discrimination for its exports or for excluding imports from economies with higher carbon footprints in their energy mix.86 Given the emerging growth and purchasing of its consumer class, Asian standards may become the global benchmark.87 Government to government intervention may be ineffective if carbon footprints are used by purchasers to discriminate between alternative suppliers throughout the value chain rather than as the basis for governments implementing trade restrictive measures.
High-quality, low-cost and low-carbon electricity grids are likely to be increasingly significant determinants of competitive advantage out to 2030.
Canada and the U.S. could shift to a low-carbon, low pollution regional energy infrastructure by optimizing the deployment88 of renewable energy to areas of comparative advantage to help moderate the demand for replacement fossil fuel power plants and to insulate its manufacturers from the potential economic impacts of Asian or other carbon-pricing mechanisms.
Meeting Asia’s increasingly diverse energy demand
Opportunities to compete in the emerging Asian energy market do not need to be based on being the most cost competitive supplier of fossil fuels, but rather on supplying new materials, technology and expertise.
While fossil fuel energy will remain an important part of Asia’s energy mix over the 10-15 year time horizon of this study, the emerging energy mix increasingly relies on a broad range of technologies for generating and managing electricity. Canada could use its experience in natural resources extraction to become a leader in supplying the raw materials upon which the renewable energy technologies and the emerging data-based economy are built. Canada could have a comparative advantage in biofuels based on its landmass. There may be opportunity for Canada to leverage the innovation made by Canadians in advanced renewable energy materials and design, energy storage and demand management as well as energy efficiency solutions. Canada has significant expertise in energy efficient buildings for diverse climates. Canada could leverage its cool climate and renewable electricity to meet rapidly expanding global demand for data centres (see box).89 Large, fast and reliable data centers could become innovation and economic hubs by attracting activities for which computational speed and/or volume are important.
Data centres: economic hubs of the digital economy
As digital technologies enable and penetrate more sectors of the Asian and global economy electricity demand associated with data processing, storage and transmission is increasing both in absolute terms as well as share of end-use energy. Intercontinental exports of electricity are not yet cost-effective, but data can today be transferred efficiently between continents using high-speed fiber optic cables. Data centers can be located in areas with low-cost, low-carbon electricity and favourable climates to reduce energy demand for cooling. Large, fast and reliable data centers could become innovation and economic hubs by attracting activities for which computational speed and/or volume are important. In an increasingly digital economy, benefits will come to those who are able to store, manipulate, transfer and apply data at the greatest speed and security and at the lowest cost and environmental impact.
Asia exports cheap renewables to the world
Low-cost renewables could challenge Canadian power utilities’ business models.
Unsubsidized renewables being able to produce electricity for the same cost as traditional power plants may challenge Canadian utilities to provide cost-competitive electricity under the existing central utility model. In coming years, innovation, increased mass production capacities and market expansion of Asian companies will continue to drive down the cost of renewable energy devices and undermine the competitiveness of Canadian central utility models.90
Canada may face multiple pressures to deregulate its electricity markets to permit greater penetration of renewable energy production and different business models for its distribution.
Asia will be an incubator and early adopter of new business models for electricity production and distribution based on the low-cost, scalability and decentralization of renewable energy. Asian-based renewable energy technology producers could look to expand their global share in foreign markets. Combined with the potential trade liberalization of environmental goods through the conclusion of the Environmental Goods Agreement91 within the World Trade Organization that would eliminate tariffs or customs duties on a broad list of green technologies and eventually on general goods and services, Asian-made rooftop PV power or wind turbines and storage technology may eventually become a viable economic option in Canada for electricity consumers owning buildings in commercial, agriculture, institutional, governmental and industrial sectors. Consumers at the individual and corporate level may also drive a shift towards increased share of renewables, which may not be connected to the existing grid, based on their low-cost and low-carbon emissions.
The cost of electricity from central power plants may become more expensive.
In the Canadian system in which supply from provincially-owed centralized power plants already meets demand, additions of renewable energy from other actors will offset energy production from the central power plants. Costs of electricity from provincial utilities could increase because large scale nuclear and thermal power plants are optimized for continuous operation. Varying or reducing output from them can reduce their efficiency and increase their cost of operation. Provincial utilities also have debt servicing burdens to cover as well as significant costs associated with maintenance of extensive long distance transmission lines that may not be required by decentralized renewable based alternatives.92 The uncertainty about the time frame in which renewable energy devices may become cost-competitive with central utilities’ prices increases the risk of public investment in large, capital intensive new power generation sources as return on investment is more uncertain.
Notes
1 Asian Development Bank. 2013. Energy Outlook for Asia and the Pacific. October.
Desai, Umesh. 2015. “China’s first green bond to spur interest for future deals.” Reuters.
2 Deloitte University Press. 2014. “Additive manufacturing: A 3D opportunity.” April 8.
Science Daily. 2015. Singapore’s first 3-D printed concept car February 3.
Licata, J. 2013. “How 3D printing could revolutionise the solar energy industry.” The Guardian. February 22.
Fingas, J. 2014. “3D-printed wind turbine puts 300W of power in your backpack.” Engadget. August 17.
3 Gebler, M. et al. 2014. “A global sustainability perspective on 3D printing technologies.” Energy Policy. November. p. 158-167.
Kreiger, M. et al. “Environmental Life Cycle Analysis of Distributed Three-Dimensional Printing and Conventional Manufacturing of Polymer Products.” 1 (12) ACS Sustainable Chem. Eng. 1511.
4 Luxresearch. 2014. State of the Market Report China’s Growing 3D Printing Ecosystem. September 8.
Lee, Mark, and Park Hyeong Yeol. 2014. “South Korea Lays the Growndwork For Industrialising 3D Printing.” 3D Printing Industry. September 29.
5 Guo, Aibing. 2015. “Sinopec Turns to New Energy, Materials for Growth as Oil Slumps.” Bloomberg Business. January 15.
3D print.com. 2015. Sinopec, China’s Largest Oil and Gas Producer, Entering 3D Printing Materials Market. January. Prototype Asia.
6Christian Baechler, Matthew DeVuono, Joshua M. Pearce. 2013. “Distributed recycling of waste polymer into RepRap feedstock.” Rapid Prototyping Journal, Vol. 19 Iss: 2, 118.
7 Hickey, Karen. 2013. What the world thinks of telecommuting. June 12.
8 Hill, David. 2012. U.S. Being Left In The Dust Of The Global Telecommuting Revolution. Singularity Hub. February 21.
9 Microsoft. Microsoft HoloLens Offical Site. 2015.
10 Verdantix. “Carbon Disclosure Project Study 2010: The Telepresence Revolution” 2010.
11 Statista. Statistics and Facts about Gaming in Asia.
12 Global Comission on the Economy and Climate. 2014. “Better Growth Better Climate; Chapter Two – Cities.”
The Nation. 2014. “Future is green for Aisan cities.” July 13.
13 China Daily. 2013. “Beijing cuts number of new cars” November 29.
14 CBC news. 2014. “Shenzhen China restricts car sales due to pollution.” December 29.
15 Urban Foresight. 2014. “EV City Casebook: 50 Big Ideas Shaping the Future of Electric Mobility.”
16 Government of India. 2012. “National Electric Mobility Mission Plan 2020.”August.
Reuters. 2015. “India’s Modi raises solar investment target to $100 bln by 2022.” January 2.
WRI. 2015. “As Obama and Modi Meet, 4 Opportunities for US-India Action on Clean Energy and Climate.” January 21.
17 Peixe, Joao. 2012. “China Targets 5 Million Electric Vehicles by 2020.” Oilprice.com. July 17.
18 The China Post. 2014. Korea aims for 200,000 electric cars by 2020. December.
19 Marquis, Christopher, et al. 2013. “China’s Quest to Adopt Electric Vehicles.” Standford Social Innovation Review.
Bloomberg Business. 2014. “China Internet Company Seeks License to Make Electric Car.” December 10.
Shahan, Cynthia. 2014. “Chinese Technology Billionaire Plans To Surpass Tesla In Electric Car Market.” CleanTechnica. December 29.
Online Video: “Firm Leshi To Build Electric Cars In China.” Chinamoneynetwork.com. December 9, 2014.
20 Fiakas, Debra. 2015. Toyota Opens The Fuel Cell Kimono January 15.
Chambers, Clem. 2014. “Tesla Giving Away Its Patents Makes Sense.” Forbes. June 13.
21 Chediak, Mark. 2014. “Musk Battery Works Fill Utilities With Fear and Promise.” Bloomberg. December 5.
22 Handleman, Clayton. 2014. “Dispelling the EV Range Anxiety Myth.” The Handleman Post. December 31.
Patel, Neel V. 2014. “Using Big Data to Fight Range Anxiety in Electric Vehicles” IEEE Spectrum. October 29.
Iters News. 2013. “OLEV Bus, wireless charging system electric vehicles – Gumi, South Korea.” August 19.
23 FrenchWeb. 2014. Réservation de taxis : l’app chinoise Didi Dache lève 700 millions de dollars. December 9.
Tech In Asia. 2014. Rocket Internet has a ridesharing company called Tripda, and it just arrived in Southeast Asia. September.
24 Kandi, Kandi Technologies Announces the Expansion of Micro Public EV Sharing Program to Nine Chinese Cities with 14,398 pure EVs Delivered as of the end of 2014, January, 7 2015; “As of the end of 2014, there have been a total of 9,852 Kandi Brand electric vehicles (“EVs”) delivered to Hangzhou, 686 EVs to Shanghai, 1,020 EVs to Chengdu, 340 EVs to Nanjing, 700 EVs to Guangzhou, 612 EVs to Wuhan, 388 EVs to Changsha, 500 EVs to Changzhou, and 300 EVs toRugao.”
25Navigant Research. 2012. “Electric Scooters in Asia Pacific Will Increase Nearly Tenfold from 2012 to 2018.” October 4.
Lukman, Enricko. 2014. “Terra Motors gets $10 million in funding to roll out electric scooters and tuk-tuks acorss Asia.” May 15. Tech In Asia.
Toyota. 2014. “i-ROAD test driving in Tokyo(link is external).” June 28.
26 Dexter Roberts et al. 2012. “The Silk Railroad of China-Europe Trade.” Bloomberg Business. December 20.
27 Guilin China International Travel Service. “Important Hihg-Speed Rail Lines in China.” China Highlights.
BBC. 2014. China: High Speed Rail Network to Be Doubled. January 13.
28 Binglin, Chen. 2015. “Wireless rail in on track as China seeks to develop world-first power system.” South China Morning Post. February 15.
29 Ro, Sam. 2013. “Chart: The Global Rise Of The Natural Gas Vehicles.” Business Insider. June 10.
ANGVA. 2014. “NGV Market Situation.” September.
30 LaMonica, Martin. 2014. “Biofuel Survivor Joule Lands New CEO, Plans Larger CO2-to-Fuel Plants.” Xconomy. November 20.
Ayre, James. 2013. “High-Octane Biofules In the Near-Future? New Lines of Engineered Bacteria Bringhte Goal Closer.” June 28.
31 Asian Development Bank. 2013. “Energy Access and Energy Security in Asia and the Pacific.” December.
Sankar, T.L. et al. Regional Energy Security for South Asia: Regional Report. Energy for South Asia.
International Energy Agency. 2014. “World Energy Outlook 2014.” November 12. pg. 240: “Last year was a milestone for China: it was the first time more renewables capacity was added (61GW) than coal (38 GW). Coal-fired capacity additions fell, in accordance with broad efforts to diversify the sector, while additions of renewables – notably hydropower and solar PV – continued to boom. China commissioned a record 31 GW of hydropower capacity in 2013. Operations began at the Xiluodu project which, at 14 GW, will rank as the third-largest hydropower plant in the world when it reaches full capacity later this year. More solar PV was added in China in 2013 than ever before (13 GW). This was partly the result of developers rush to complete projects ahead of an early 2014 deadline to qualify for an electricity production subsidy. Recent developments in Japan, along with those in China, underscore the shift in the balance of solar PV installations to Asia. Japan has a considerable volume of approved solar PV projects in the pipeline (69 GW), under a generous feed-in-tariff scheme, 6 GW of which were completed in 2013.”
Cloete, Schalk. 2014. “Evaluating Fifteen Years of IEA Energy Forecasts.” The Energy Collective. December 16.
Mathews, John A. and Hao Tan. 2014. “Economics: Manufacture renewables to build energy security.” Nature. September 10. vol. 513, issue 7617.
International Energy Agency. 2014. “World Energy Outlook 2014.” November 12. p. 240
Larson, Christina. 2014. “China’s Coal Demand May Peak Before 2020.” Bloomberg Business. December.
The Energy Collective. 2015. “China’s Coal Consumption Fell in 2014.” January.
RTCC. 2015. “Chinese coal demand fell in 2014.” January.
Lan, Lan. 2014. “Renewables get a China push.” China Daily USA. June 5.
Myllyvirta, Lauri. 2015. “New Coal Plants in China: A (carbon) Bubble waiting to Burst.” The Energy Collective.February 23.
Haugwitz, Frank. 2015. “Is China ready for 20GW in 2015?” PVTech. July 27.
Frankfurt School-UNEP Centre. 2014. Global Trends in Renewable Energy Investment 2014.p. 24. “Kazakhstan develops alternative energy” CentralAsiaOnline. December 3, 2014.
ASEANUp. 2014. “Future perspectives for energy in Southeast Asia.” October 27.
Bogatik, Alexander. Government of India. 2015. “Renewable Energy Programmes Gets A New Impetus; Focus on Development of Energy Infrastructure.” February 13.
GeoBeats News. 2013. World’s Largest Solar Power Plant to Be Built in India. September 26.
WildFilmsIndia. 2014. Massive solar installation at Thailand’s Sunny Bangchak PV power plant June 24.
International Renewable Energy Agency. 2015. “Renewable Power Generation Costs in 2014“, January 20. Figure 2.1, p. 27.
Ibid. Figure 2.3, pg. 30; pg. 36-37
Ibid. pg. 27-28
Giles Parkinson. 2015. “Solar Costs Will Fall Another 40% In 2 Years.” REneweconomy. January 20.
Bloomberg New Energy Finance. 2014. “2030 Market Outlook: Focus on Asia Pacific.”
Deutsche Bank. 2015. “Deutsche Bank’s 2015 solar outlook: accelerating investment and cost competitiveness” January 13. “Unsubsidized rooftop solar electricity costs anywhere between $0.13 and $0.23/kWh today, well below retail price of electricity in many markets globally. The economics of solar have improved significantly due to the reduction in solar panel costs, financing costs and balance of system costs. We expect solar system costs to decrease 5-15% annually over the next 3+ years which could result in grid parity within ~50% of the target markets. If global electricity prices were to increase at 3% per year and cost reduction occurred at 5-15% CAGR, solar would achieve grid parity in an additional ~30% of target markets globally. We believe the cumulative incremental total available market for solar is currently around ~140GW/year and could potentially increase to ~260GW/year over the next 5 years as solar achieves grid parity in more markets globally and electric capacity needs increase.”
International Renewable Energy Agency. supra note 35, Figure 2.12, pg. 44.
Hui Hong, Chou. 2013. “Water Management Biggest Risk to China Shale Gas, Bernstein Says.” Bloomberg Business. June 14.
de Morsella, Chris. 2011. Fifteen Grid Scale Energy Solutions to Watch.
Navigant Research. 2015. Revenue from Grid-Scale Energy Storage is Expected to Total More than $68 Billion from 2014-2024 January 6.
Overton, Thomas. 2014. Europe’s Largest Battery Storage Project Begins Operations in UK. December 15.
Larson, Aaron. 2014. Europe’s Largest Commercial Battery Storage Facility Opens. November 1.
Mueller, SC, et al. 2014. “Monitoring innovation in electrochemical energy storage technologies: a patent-based approach.” Applied Energy. DOI: 10.1016/j.apenergy.2014.06.082
Vehicle to Home Electricity Supply System; Nissan Motor Corporation.
Eneres Company. 2014. ENERES Starts New Battery Management Verification Test Reusing Car Battery of Nissan Leaf. November 12.
Casey, Tina. 2014. Sumimoto Hopes To Settle Used EV Batteries Energy Storage Question. February 10.
Hockenos, Paul. 2014. Germany’s Revolution in Small Batch, Artisanal Energy. October 31.
For Asia, see Breyer et al. 2014. “North-East Asian Super Grid: Renewable Energy Mix and Economics.” 6th World Conference of Photovoltaic Energy Conversion (WCPEC-6). November 24 – 27. Kyoto, Japan.
Agora Energiewende. 2014. Electricity Storage in the German Energy Transition. December.
The World Bank. 2014. “Bringing China’s Energy Efficiency Experience to the World: Knowledge Exchange with Asian Countries.” June 27.
Xiaolei Gu. 2012. “China Releases Blueprint to Promote Seven Emerging Industries.” China Briefing. June 1.
China Briefing. 2012. “China Releases 12th Five-Year Plan for National Strategic Emerging Industries.” July 25.
Government of India, Jawaharlal Nehru National Solar Mission, Ministry of New and Renewable Energy.
Pashley, Alex. 2015. “India primed for renewables spurt in climate plan.” RTCC. August 24.
51 China’s State Council’s. “Energy Saving and New Energy Auto Industry Development Plan 2012-2020”, argued that “Sustainable development of the automobile industry, including transformational upgrading, is an urgent task and is important for new economic growth and international competitive advantage.” India sets out its objective to emerge as a leader in the global market for electric two and four wheel vehicles by 2020 in its National Electric Mobility Mission Plan 2020.
Bloomberg Business. 2015. “BYD Targets German Homes With New Power-Storage Units.” June 10.
Paton, James. 2015. “Buffet-backed BYD enters power-storage market in Australia.” The Sydney Morning Herald: Business Day. July 10.
52 Government of India. 2012. “National Electric Mobility Mission Plan 2020”.
Howell, S. et al. 2014. “Leapfrogging or Stalling Out? Electric Vehicles in China.” Harvard Kennedy School. July. p. 4.
53 Zachary Shahan. 2015. “1st Certified Electric Passenger Plane Comes From…” Clean Technica. July 15, 2015.
54 Mathews, John A. and Hao Tan. 2014. “Economics: Manufacture renewables to build energy security.” Nature. September 10. vol. 513, issue 7617.
World Energy Council. 2013. “World Energy perspective: Cost of Energy Technologies.” p. 19.
55 Worsening pollution has pushed environmental issues up the public agenda in Asia in recent years. For example in China, an opinion poll conducted by state-run newspaper China Youth Daily shows that environmental governance is now the public’s number one concern. In response to growing frustration, the State Council launched an ambitious action plan to combat air pollution, worth 1.7-trillion-yuan (US$277 billion), in September 2013. Earlier this year, the environment ministry said similar action plans were forthcoming for water and soil pollution.
Le Monde. 2014. Chine: Comprendre l’ampleur de la pollution en trois minutes. February 13.
EuroNews. 2013. Toxic Smog Chokes India Capital. February 1.
56 Asian Development Bank. 2012. “Key Indicator for Asia and the Pacific,” Highlights. p.3
Qiu, Jane. 2012. “Megacities pose serious health challenge.” Nature. October 12.
57 WHO. 2014. “7 million premature deaths annually linked to air pollution.” March 25.
58 IPCC. 2014. “Climate Change 2014: Impacts, Adaptation, and Vulnerability.” Chapter 24.
Foreign Policy. 2014. “Why South Asia Is So Vulnerable to Climate Change.” April 22.
Yow, Micheal and Tyler Hamilton. 2014. “Sustainable Asia.” Corporate Knights. October 16.
59 NewScientist. 2014. “Beijing’s coal ban may herald the end of the fuel.” August 7.
AP. 2014. “China to ban all coal use in Beijing by 2020.” August 5.
DW. 2014. “China tackles air pollution with ban on sulfurous coal.” August.
KPMG. 2014. “Taxes and Incentives for Renewable Energy 2014: China.”
60 IETA. 2013. “Kazakhstan: The World’s Carbon Markets: A Case Study Guide to Emissions Trading.” September.
61 Reuters. 2015. “South Korea launches world’s second-biggest carbon market.” January 12.
62 White House. 2014. U.S.-China Joint Announcement on Climate Change and Clean Energy Cooperation. November 11.
63 International Centre for Trade and Sustainable Development. 2014. China confirms 2016 national carbon market plans. November 27.
64 World Bank. 2014. State and Trends of Carbon Pricing: Emission trading regime will start in January 2015 in South Korea. An Emission trading scheme is under consideration in Japan and Thailand.
65 Revenue from this tax (approximately US$ 1.1 billion in FY 2014-15) feeds the National Clean Energy Fund established to provide low-cost finance to renewable energy projects and the Green Corridors transmission project
Smiti Mittal. 2014. “India Doubles Tax On Coal To Fund Clean Energy, Environmental Projects.” Clean Technica. July 20. http://cleantechnica.com/2014/07/20/india-doubles-tax-coal-fund-clean-energy-environmental-projects/
66 World Bank. 2014. “Putting a Price on Carbon with a Tax.” http://www.worldbank.org/content/dam/Worldbank/document/SDN/background-note_carbon-tax.pdf ; Revenue (estimated at ¥262.3 billion per year) is used to strengthen renewable energy and energy saving measures.
67 Liu, Coco. 2014. “China lures companies into carbon footprint labeling.” E&E News. July 15. http://www.eenews.net/stories/1060002822
68 The Sustainability Index is comprised of metrics to measure a range of environmental impacts of products, including energy use and greenhouse gas emissions, developed in partnership with the Sustainability Consortium, which comprises “90 members from all corners of business employing over 8.5 million people and whose combined revenues total over $2.4 trillion.” The Sustainability Consortium is jointly administered by Arizona State University and University of Arkansas with additional operations at Wageningen University in The Netherlands and Nanjing University in China.
69 https://www.youtube.com/watch?v=cvUcrzhDxiE
70 Greenpeace. 2011. “How dirty is your data?: A look at the Energy Choices that Power Cloud Computing.”
71 While solar power was the example given here, scalability in other renewables and in small modular reactors (new generation of nuclear power plant) is also possible.
72 Woodrow Wilson School. Rural Energy Alternatives in India: Opportunities in Financing and Community Engagement for Renewable Energy Microgrid Projects. Princeton University. p 20. https://wws.princeton.edu/sites/default/files/content/591f%20Rural%20Energy%20Alternatives%20in%20India.pdf.
73 Asian Development Bank. 2013. “India Solar Power: Pay-As-You-Go Solar Power.” September 17. http://www.adb.org/features/pay-you-go-solar-power-small-idea-big-results
A. 2014. “Starved for Power, New Indian Government Translates “Chicken in Every Pot” Into “Solar on Every Roof.” The Energy Collective. May 24. http://theenergycollective.com/asiegel/385596/starved-power-new-indian-government-translates-chicken-every-pot-solar-every-roof
Ministry of Energy and Mineral Resources of Indonesia. 2011. 1,000 Solar Power Plants for 1,000 Islands in Indonesia. October. http://www.esdm.go.id/news-archives/electricity/46-electricity/5053-1000-solar-power-plants-for-1000-islands-in-indonesia.html
PR Newswire. 2014. Suntech Launches 7.5 MW of Off-Grid Projects to Power Schools and Villages in Malaysia. July. http://www.prnewswire.com/news-releases/suntech-launches-75-mw-of-off-grid-projects-to-power-schools-and-villages-in-malaysia-269352771.html(link is external) ; Reuters, Bangladesh aims to be world’s first solar nation, January 25 2015, http://www.trust.org/item/20150125132735-4btvj/?source=jtOtherNews2(link is external)(link is external)
WEF. 2015. “How Pakistan is taking advantage of solar power.” February 20. https://agenda.weforum.org/2015/02/how-pakistan-is-taking-advantage-of-solar-power/(link is external)
World Bank. 2013. Women Empowered by Solar Energy in Bangladesh. August 6. https://www.youtube.com/watch?v=6K7q7l_BAAk(link is external)
74 New Energy Promotion Council, Japan Smart City Portal.(link is external)
75 South Asia made a regional super electricity grid a reality in November 2014 with the signature of the SAARC Framework Agreement for Energy Cooperation (Electricity), “realizing the common benefits of cross-border electricity exchanges and trade among the SAARC Member States leading to optimal utilization of regional electricity generating resources, enhanced grid security, and electricity trade arising from diversity in peak demand and seasonal variations.” South Asian Association for Regional Cooperation. “SAARC Framework for Energy Cooperation (Electricity)(link is external)” November 27, 2014.
Techmonitor. “Super Grid in North-East Asia Through Renewable Energy(link is external), KEPCO. 2013. “Energy Co-operation through Establishing North-East Asia Supergrid(link is external).”
The Daily Bangladesh. 2014. “Handshake, signatures salvage Saarc.(link is external)” November 28.
76 Breyer et al. 2014. North-East Asian Super Grid: Renewable Energy Mix and Economics, 6th World Conference of Photovoltaic Energy Conversion.
77 Vientian Times, Laos eyes sale of electricity to Singapore(link is external), January 14, 2015: “As of October last year, Laos had 25 operational hydropower plants with a total installed capacity of about 3,230MW, exceeding domestic consumption needs of about 1,000MW. Laos has strong potential to build hydroelectric plants with a combined installed capacity of about 28,000MW, including the existing dams.
Asian Development Bank. 2014. “Bhutan’s Hydropower Sector: 12 Things to know.(link is external)” January.
78 Bloomberg. 2014. “China out-spends the US for first time in $15bn smart grid market.(link is external)” February.
79 GSMA. 2014. How China is set for global M2M Leadership(link is external). June.
Poindexter, Owen. 2014. “The Internet of Things with Thrive on Energy Efficiency.(link is external)” FutureStructure. July 28.
80 The Economist. 2014. “Negawatt hour.” March 1: “Only for China, energy service company revenues grew from nearly zero in 2005 to $ billion in 2010.”
81 IEA. 2014. Capturing the Multiple Benefits of Energy Efficiency. p. 20: Singapore recently invested $100 million in energy efficiency programs.
Shah, Vaidehi. 2014. “$100 million for Singapore’s road to energy efficiency(link is external).” Ecobusiness. August 1.
82 Cisco. “The City of The Future.”
83 The Economist. 2015. New Business models: All change(link is external). January 17.
84 BP. Energy outlook 2035. http://www.bp.com/en/global/corporate/about-bp/energy-economics/energy-outlook.html(link is external)
ExxonMobil. The Outlook for Energy: A View to 2040. http://corporate.exxonmobil.com/en/energy/energy-outlook(link is external)
International Energy Agency. 2014. World Energy Outlook 2014. http://www.worldenergyoutlook.org/publications/weo-2014/(link is external)
85 McGlade, Christophe and Paul Ekins. 2015. “The geographical distribution of fossil fuels unused when limiting global warming to 2° C.” Nature. p. 517.
Leach, Andrew, “Are oil sands incompatible with action on climate change?”, Maclean’s, 2015, http://www.macleans.ca/economy/economicanalysis/are-oil-sands-incompatible-with-action-on-climate-change/(link is external)
Lewis, Jeff, “Is oil sand development still worth it?”, October 28, 2014, http://www.theglobeandmail.com/report-on-business/rob-magazine/is-oil-sands-development-still-worth-it/article21334385/(link is external)
The profitability and viability of liquefied natural gas projects in Canada may depend on high natural gas prices in Asia, Nikiforuk, Andrew, “Tanking Asia Gas Prices Makes BC LNG Not Viable, expert says”, The Tyee, January 15 2015, http://thetyee.ca/News/2015/01/15/Gas-Prices-BC-LNG/(link is external)
86 Asia Pacific Foundation of Canada. “Will Asian Countries Limit Imports of Oils with Relatively High GHG Emission Profiles?” October 14, 2014 http://www.asiapacific.ca/blog/will-asian-countries-limit-imports-oils-relatively-high-ghg(link is external)
87 Eco-Business. 2015. “Report: the green building era hits China.” http://www.eco-business.com/news/report-the-green-building-era-hits-china/(link is external)
88 WEF. The future of Electricity: Attracting investment to build tomorrow’s electricity sector, January 2015, p. 14-15. : “where Spain has about 65% more solar irradiation than Germany (1750 vs 1050 kWh/m2), Germany installed about 600% more solar PV capacity (33 GW vs 5 GW). In contrast, whereas Spain has less wind than countries in the north, it has still installed 23 GW of wind capacity. Such suboptimal deployment of resources is estimated to have cost the EU approximately $100 billion more than if each country in the EU had invested in the most efficient capacity given its renewable resources. And by looking across borders for the optimum deployment of renewable resources (with associated physical interconnections), the EU could have saved a further $40 billion.”
89 Centre for Energy-Efficient Telecommunications. 2013. “The Power of the Wireless Cloud.” June. http://www.ceet.unimelb.edu.au/publications/downloads/ceet-white-paper-wireless-cloud.pdf(link is external)
Robinson, Andrew. 2014. Personal Communication. (Asian Data Centres’ Energy Use: Overview and Scenarios to 2030.) November 17.
90 Mathews, John A. and Hao Tan. 2014. “Economics: Manufacture renewables to build energy security.” September 10. Nature, vol. 513, issue 7617.
91 WTO. 2014. Joint Statement regarding the launch of the environmental goods agreement negotiations(link is external). July.
92 CleanTechnic. 2015. This Graph Dispells The Myth That Cheap Gas Means Cheap Energy. January. http://cleantechnica.com/2015/01/16/graph-dispells-myth-cheap-gas-means-cheap-energy/